
Introduction:
This article will look at identifying and resolving the most common performance issues that can occur in Windows Virtual Desktop Environments. Following the provided steps in this article, you will identify issues relating to capacity, constraint and overall performance lag.
There are four (4) Key areas when troubleshooting performance in WVD. These are:
- CPU
- DISK
- RAM
- Network
I have listed these four core components in a particular way to spell out a WVD troubleshooting acronym I have created called “CDRN”.
CPU Troubleshooting:
CPU related constrains are quite common with session based desktops. This can be for a number of reasons and web browsers can be one of the culprits if hardware rendering is left enabled.
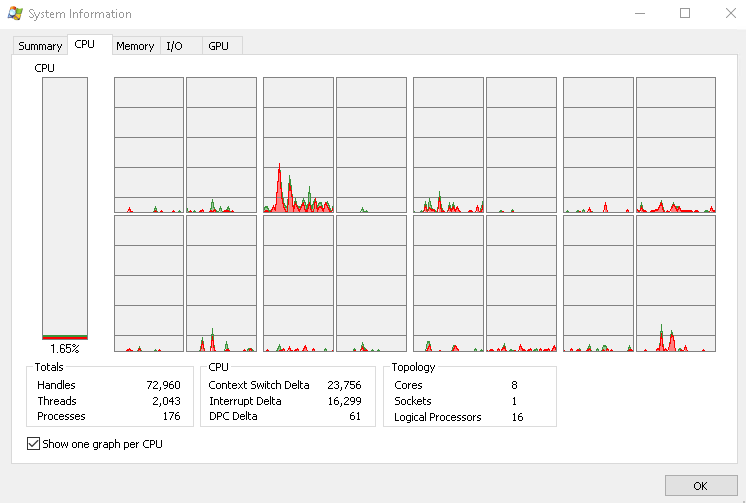
You can view CPU usage using the Sysinternals Process Explorer or the Task Manager.
If the CPU is flat lining or spiking above 70% continually, it is more than likely that the CPU is constrained.
Sysinternals process Explorer helps you delve into the detail to understand what applications / Services are consuming large amounts of CPU resource. This allows you to kill said service or identify if there are too many users on one Host.


CPU Troubleshooting key points:
- Low RAM can cause the CPU to spike and increase disk activity (paging RAM).
- Hardware rendering not disabled in the web browser and users are streaming the latest and greatest TV shows can hamper CPU performance.
- Enabling the CPU time column allows you to see which process has been consuming resource over what time.

CPU Contention Symptoms:
This a non exhaustive list of potential symptoms you may experience when CPU is under contention.
- Slow switching between windows
- loading cursor for long periods of time.
- Slow logon and Log Off
- Applications not responding
- Web pages jumpy and loading slowly.
Disk Troubleshooting
There are two areas when it comes to disk related performance issues.
The first is the OS disk of the virtual machine. It is quite common for IT admins to forget about the OS disk and concentrate on compute sizing. When sizing incorrectly, you will experience issues with overall useability. The smaller disk sizes have lower throughput and IOPs availble which is not great for multi session deployments.
You need to size the OS disk in accordance with the total number of users per host.

Most deployments should using P15 or higher to ensure there is enough IOPS to serve all the user applications.
Choosing the wrong sized virtual machine could result in limiting the potential throughput allowed by the disk.

One of the quickest ways of identifying a disk performance issue, is to review the disk queues within Resource Monitor.

You can also run the following in command line:
typeperf -si 2 "\PhysicalDisk(*)\Avg. Disk Queue Length"

FSlogix Profile Containers:
Using the wrong type of storage account for Azure files can cause performance issues with FSlogix profile disks. You would also need to factor in size and IOPs required for your user base. Do users have large user profiles or do they mainly use web applications. Make sure you are using premium storage or Azure Netapp files for large deployments. The indexed search not enabled can also create performance issues and a slow experience during logon. You can also use a Scale out file server if you want to go traditional Iaas.
Disk Troubleshooting Key Points:
Points to take away!
- Do not use standard disks as your environment will flop.
- Use P-type SSD disks for Multi Session and file services. You can also attach multiple disks to a VM allowing I/O to be spread across multiple disks.
- Use premium storage for azure files for best results.
- ensure that Indexed search cache is enabled on FSLogix as a rebuild can cause IO storms if lot of users are logging in at one time.
- Stop users streaming services including radio and music.
- Scale Out File Server can spread the I/O across multiple disks.
Disk Performance Symptoms:
This is a none exhaustive list of Disk performance symptoms.
- Slow to open and Save files
- Slow at switching screens.
- Slow logon and log off
- applications not responding
- slow launch of applications
Troubleshooting RAM Related Performance Issues:
The challenge we all have is core business applications like Edge, Teams, and outlook (modern Applications) that can consume copious amounts of RAM.
High memory utilization is not the issue, the challenge comes when applications load their data into RAM. When the RAM is fully consumed, the page file kicks in which then starts to impact the performance of the Session Host.
A Pagefile (when using a SSD) has a estimated write speed of 456MB/Sec and RAM can write at estimated speeds of 12,800MB/sec. When RAM is consumed, performance drops to SSD or standard disk speeds which will most likely cause performance degradation.

Reviewing hard faults is the quickest way to identify performance issues and usually its related to too many users on one host heavily using applications like Excel.

RAM Troubleshooting Key Points:
- Balancing users across hosts is important to ensure that you do not experience RAM issues.
- If you do, the quickest way to resolve this would be to stop drain and ask a subset of users to log off and log back in to a different host.
- Automatic log off of users and regular reboots of the VM can also help avoid RAM issues.
RAM Performance Symptoms:
- unexpected application crashes
- Windows errors for low memory
- Slow log on and log off
- applications “Not Responding”
- Slow application launching
- running applications slow
Troubleshooting Network Related performance issues:
There are three key areas to look at when troubleshooting networking related issues.
- User endpoint device
- WVD Management Service
- Azure Virtual Machine (Virtual Desktop)
What Does Network Contention Look Like:
- Delay when drawing in MS Paint.
- Jittery mouse
- audio degradation or distortion
- slow screen connection
- continual dropping of the session.
- Screen goes blank, then reappears
- Delayed cursor and typing.
Network contention is usually at the User side. However there are times when there could be a issue with the Connection broker, Gateway or communication from the host agent to the WVD Management Service.
WVD Management Service issues would require you to contact MS Azure support.
Useful Tips to Identify A Network Issues:
- Broadband speed test on the user endpoint device.
- Ping using PS Ping Microsoft (www.microsoft.com) or ping the RDweb service “psping rdweb.wvd.microsoft.com:443” or the RDbroker “psping rdbroker.wvd.microsoft.com:443”
- You can also identify the gateway by right clicking the Remote Desktop session, session main window bar and clicking the gateway information. This will provide you with the gateway FQDN so you can ping this address to test.


- You can use the community tool Connection Experience Indicator for RDS & WVD to see the latency and overall experience in session.
- Force a azure virtual machine to “redeploy” which essentially moves the virtual machine from one physical host to another in Azure.
- Use an application like clumsy to generate latency and load on the client or server side to pin point issues.
- check the status of the RDS Session host Status using powershell.
- disable software firewalls temporarily to see if this makes a difference.
- Is it CPU/RAM or DISK related and not network at all ?
Useful Tools:
- psping – https://docs.microsoft.com/en-us/sysinternals/downloads/psping
- Process explorer – https://docs.microsoft.com/en-us/sysinternals/downloads/process-explorer
- Iperf – https://iperf.fr/
- Speedtest – https://www.hulltelco.co.uk/broadband-speed-test/
- Experience indicator
- Clumsy – https://jagt.github.io/clumsy/download.html
Summary:
This article provides the basics for troubleshooting performance with Windows Virtual Desktop. We covered CDRN and what to look out for. Disk sizing is the one to watch out for as this seems to be the most common issue which catches people out.

Leave a comment